Michael Mauboussin on the Santa Fe Institute and Complex Adaptive Systems

Michael Mauboussin of Credit Suisse is one of the best strategists on Wall Street and a thought leader who consistently introduces some of the most compelling topics to the financial community. It is therefore no surprise Mauboussin is now Chairman of the Board of Trustees at the Santa Fe Institute, an organization which specializes in the multi-disciplinary study of complex adaptive systems. I recently had the privilege of interviewing Mauboussin about his involvement with the Santa Fe Institute and his thoughts on complexity. Enjoy (and be sure to follow the links to some fascinating further readings):


Elliot: Now that you’re Chairman of the Board of Trustees at the Santa Fe Institute, what are your goals and visions for how to more broadly inject SFI’s lessons on complexity into the financial community’s understanding of markets?

Michael: In my role at SFI, the primary goal is to make sure that the Institute does, and can, do great science. The unifying theme is the study of complex adaptive systems. But the goal is to have a place where there’s support for important, transdisciplinary research. 

That said, I would love to continue to see this type of thinking work its way into our understanding of financial markets. That is happening to some degree. One example is Andrew Lo’s work on the Adaptive Market Hypothesis. Another example is Blake LeBaron’s work on markets using agent-based models. I think it’s a more complete way of viewing markets than a standard rational agent model or the assumption of the absence of arbitrage. The problem is that modeling complex adaptive systems is a lot messier than those other approaches.

Elliot: When we last met at an event introducing The Success Equation to SFI members in New York, I asked you what the right “success equation” is for a young investor. Your response was to “keep coming to these events.” How did you first learn about the Santa Fe Institute? And how did you come to embrace the SFI?

Michael: I first learned about SFI in 1995 at a Baltimore Orioles baseball game, where Bill Miller was my host and the proselytizer. He explained how this new research group dedicated to the study of complex systems was coming up with cool and useful insights about business and markets. Specifically, he was taken with Brian Arthur’s work on “increasing returns.” This work showed that under some conditions returns actually move sharply away from the mean. This is counter to classic microeconomic thinking that assumes returns are mean-reverting. 

In many ways I was primed for the message. I had been doing a lot of reading, especially in the area of science, and so this way of thinking made sense to me from the beginning.

Elliot: Did you have a bias towards one market philosophy before you adopted the complex adaptive system mental model?  

Michael: Although I had a solid liberal arts background before starting on Wall Street, I had very little background in business or finance. As a result, I had few preconceived notions of how things worked. It’s a challenge to come up with clear conclusions based on an observation of what happens in markets. On the one hand, you see clear evidence that some people do better than the indexes and that there are patterns of booms and crashes over the centuries. These suggest that markets are inefficient. On the other hand, there’s also clear evidence that it’s really hard to beat the market over time, and that the market is more prescient than the average investor. So for me, at least, there was an intellectual tug of war going on in my head. 

I have to admit to being struck by the beauty of the efficient markets hypothesis as described by the economists at the University of Chicago. At the forefront of this, of course, was Eugene Fama, who recently won the Nobel Prize in part for his work in this area. What’s alluring about this approach is that it comes with a lot of mental models. You can equate risk with volatility. You can build portfolios that are optimal relative to your preference for risk. And so forth. Because you can assume that prices are an unbiased estimate of value, you can do a lot with it. The market’s amazing ability to impound information into prices impresses me to this day.

So it was with this mental tug of war as a backdrop that I learned about the idea of complex adaptive systems. Suddenly, it all clicked into place. A simple description of a complex adaptive system has three parts. First, there are heterogeneous agents. These can be ants in an ant colony, neurons in your brain, or investors in a market. Second, these agents interact leading to a process called “emergence.” The product of emergence is a global system that has properties and characteristics that can’t be divined solely by looking at the underlying agents. Reductionism doesn’t work

What instantly drew me to this way of thinking is that it describes markets very well and it is very common in nature. The central beauty of this approach is that it provides some sense of when markets are likely to be efficient—in the classic sense—and when inefficiencies will creep in. Specifically, markets tend to be efficient when the agents operate in a truly heterogeneous fashion and the aggregation mechanism is working smoothly. Diversity is essential, both in nature and in markets, and the system has to be able to take advantage of that diversity. There are some neat examples in experimental economics to show how this works. It’s really wondrous. 

On the flip side, when you lose diversity the system can become very inefficient. And that’s also what we see in markets—diversity loss leads to booms and crashes. Now the loss in diversity can be sociological, in which we all start to believe the same thing, or it can be technical, such as the winding up or winding down of a leverage cycle. But here we have a framework that accommodates the fact that markets are pretty darned good with the fact that they periodically go haywire. And SFI was at the center of this kind of thinking.

Elliot: It’s interesting that your answer on what theory of markets you subscribe to is not in the “black or white” vein whereby one must be in one camp and one camp only. It seems like much of the divisiveness in today’s discourse (in many arenas) stems from people’s unwillingness to see these kinds of shades of grey, though as you suggest, that mentality is not for everyone.  Do you meet resistance from people when explaining your stance? Is there a way to get others to embrace “complexity” when people have an innate desire for linear, orderly explanations that are essentially either/or answers? 

Michael: Most of us are uncomfortable with ambiguity—we’d rather just have a point of view and stick to it. But in markets, the real answer clearly lies between the folks who believe that markets are perfectly efficient and those who believe it’s largely inefficient. By the way, if you think the market is mostly inefficient there is no reason to participate because even if you have a sense that you are buying a dollar at a discount there is no assurance that the market will ever recognize that value. So some degree of market efficiency is essential even for those who believe that markets have inefficiencies. 

My goal is less to get people to change their view and more to establish a better understanding of how things work. Once you learn about markets as a complex adaptive system and appreciate its implications, I find it difficult to go back to a more traditional point of view.  

Elliot: In More Than You Know, you said, “The best way to describe how I feel following a SFI symposium is intellectually intoxicated.” Are there steps you take following these events to transform the ideas you’ve learned and the relationships you’ve built into expanding the scope of your own knowledgebase? And how are you able to harness this intoxication into productive output? 

Michael: I wish I could be more systematic in this regard, but I think it’s fair to say that the ideas from SFI have permeated every aspect of my work. Perhaps a couple of examples will help make the point.

I’ve already mentioned conceptualizing markets as a complex adaptive system. This alone is a large step, because rather than simply moaning about the limitations of standard finance theory, you have a framework for thinking about what’s going on.

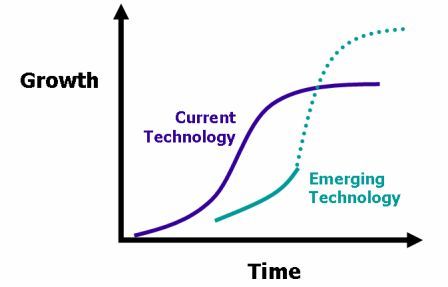
I’ve also already mentioned Brian Arthur’s work on increasing returns. Many businesses are being defined less by their specific market segment and more by the ecosystem they create. And it is often the case that in a battle of ecosystems, one will come out on top. So this set of steps provides a mental model to understand the process of increasing returns and, as important, how to identify them in real time.

Ideas from SFI have inspired my work in many other ways, from understanding power law distributions in social systems to network theory to collective decision making to the processes underlying innovation. I could go on. But suffice it to say that there is hardly an area of markets, business, or decision making where your thinking wouldn’t be improved by learning, and internalizing, the kinds of ideas coming out of the SFI.

Elliot: In More Than You Know, you also introduce Charlie Munger and SFI as “Two sources in particular [that] have inspired my thinking on diversity. The first is the mental-models approach to investing, tirelessly advocated by Berkshire Hathaway's Charlie Munger. The second is the Santa Fe Institute (SFI), a New Mexico-based research community dedicated to multidisciplinary collaboration in pursuit of themes in the natural and social sciences.” It seems only natural that adopting Charlie Munger’s perspective to mental models would lead one to the SFI. Can you talk about the synergies between these two worldviews in making you a better analyst? What role did your adoption of Munger’s framework play in your attraction to the SFI?

Michael: Charlie Munger is a very successful businessman. Probably the first thing to note about him is that he reads constantly. He’s a learning machine. There’s bound to be a good outcome if you dedicate yourself to reading good stuff over a long period of time. That alone should be inspiring.

So as I think about the synergies between the worldviews, a few thoughts come to mind. First, it’s essential to provide your mind with good raw material. That means exposing yourself to a lot of disciplines and learning the key tenets. It also means spending time with people who think differently than you do. 

Second, you have to be willing and able to make connections. What are the similarities between disease and idea propagation? What can an ant colony teach me about innovation? What do physical phenomena, such as earthquakes, tell us about social phenomena, such as stock market crashes? You need good raw material to make connections, but you also have to be careful to avoid superficial links.

Finally is the idea of thinking backwards. Munger is a big advocate for this. You observe that something is where it is: How did it get there? Why did it get there? There are some fascinating challenges in this regard right now. We know, for example, that the sizes of cities and companies follow power laws. Why? By what mechanism does this happen? No one really knows, and the prospect of solving those kinds of challenges is exciting.   

But I have to finish with the point that this approach to the world is not for everyone. The interest or capability to work in this fashion is far from universal. So I wouldn’t recommend this to everybody. Rather, I would encourage it if you have a proclivity to think this way.  

Elliot: You talk of a benefit of the mental models approach as having a diverse array of models that you can fit a given situation, rather than fitting a given situation to a one-size-fits-all model.  Can you shed some insight on a) how you built up your quiver of models; b) how you organize these models (either mentally or tangibly); and c) how you choose which model to use in a given situation?

Michael: Yes, I think the metaphor is that of a toolbox. If you have one tool only, you’ll try to apply it to all of the problems you see. And we all know people who are just like that.

The mental models approach seeks to assemble a box with many tools. The idea is to learn the big ideas from many disciplines. What are the main ideas from psychology? Sociology? Linguistics? Anthropology? Biology? And on and on. In many cases you don’t have to be a deep expert to get leverage from a big idea. One of my favorite examples is evolution. Spend some time really understanding evolution. It is a mental model that applies broadly and provides insights that other approaches simply can’t.

I’m not sure I’m much of an example, but I have strived to read widely. This in part has been inspired by the people and ideas I have encountered at SFI. Most of my organization comes through writing or teaching. For me, that is a way to consolidate my understanding. If I can’t effectively write or teach something, I don’t understand it. Now I’m sure I write about things I don’t understand as well, but I try my best to represent the science as accurately as possible.

As for choosing the right model, the key there is to look for a fit. One concept that intrigues me is that nature has taken on and solved lots of hard problems, and there’s a lot we can learn from observing how nature works. So you might learn how to run a committee more effectively if you understand the basic workings of a honeybee colony. Or you might have insight about the resources your company should allocate to experimentation by examining ant foraging strategies. 

The risk is that you take the wrong tool out of the toolbox. But I think that risk is a lot smaller than the risk of using the same tool over and over. I’ll also mention that the work of Phil Tetlock, a wonderful psychologist at the University of Pennsylvania, suggests that so-called “foxes,” people who know a little about a lot of topics, tend to be more effective forecasters than so-called “hedgehogs,” those with a single worldview. So not only is this an intellectually appealing way to go, there’s solid evidence that it’s useful in the real world. 

Elliot: When you cite how Brian Arthur’s work “showed that under some conditions returns actually move sharply away from the mean. This is counter to classic microeconomic thinking that assumes returns are mean-reverting.” It makes me think about feedback loops and this passage from More Than You Know: “Negative feedback is a stabilizing factor, while positive feedback promotes change. Too much of either type of feedback can leave a system out of balance.” Positive feedback loops are seemingly the force that drives conditions away from the mean. How can we think about feedback loops in a more constructive way and are there steps that we can take to understand when/where/how they will appear?  As a follow-up, is there a good mental model for thinking about when and how breakpoints appear in feedback loops?

Michael: There’s been a great deal written about this idea, albeit not necessarily using this exact language. One classic work on this is Everett Rogers’s book, Diffusion of Innovations. He was one of the first to describe how innovations—whether a new seed of corn or an idea—spread. From this a lot of other ideas emanated, including the idea of a tipping point, where momentum for diffusion accelerates. 

The Polya urn model is also useful in this context. A basic version of the model starts with balls of two colors, say black and white, in an urn at some ratio. You then randomly select one ball, match it with a ball of the same color, and replace it. For example, say you started with 3 black balls and 3 white balls, so 50 percent of the balls are black. Now you draw a ball, observe that it’s black, and return it to the urn with an additional black ball. So the percentage of black balls is now 57 percent (4/7). 

This urn model is very simple but demonstrates the principles behind positive feedback nicely. Specifically, it’s nearly impossible in advance to predict what’s going to happen, but once one color gets ahead sufficiently, it dominates the outcomes. (You can play a little more sophisticated version here.) It’s interesting to hit the simulator over and over to simply observe how the outcomes vary.

Another area where this model pops up is in format, or standard, wars. The classic example is Betamax versus VHS, but there are plenty of examples throughout history. Here again, as one standard gets ahead, positive feedback often kicks in and it wins the war.   

Now I don’t think there’s any easy way to model positive feedback, but these are some of the mental models that may help one consider what’s going on.

Elliot: You talk about Munger’s advice to think backwards and invert. I think your first book was Expectations Investing which provided a framework for estimating the embedded assumptions in an equity’s price. Yet you also warn that this way of thinking isn’t for everyone. Was this something you realized after sharing the ideas with many or were you always aware of this? Do you have any ideas for why this has a relatively narrow audience? Is there a natural tie-in to the behavioral biases of humans and why this doesn’t work for everyone? (For example, the human proclivity towards the narrative bias to explain past events) And if so, how can we think backwards more rationally and overcome these biases?

Michael: Steven Crist, the well-known handicapper, has a line about horse race bettors in his essay, “Crist on Value,” that I love to repeat. He says, “The issue is not which horse in the race is the most likely winner, but which horse or horses are offering odds that exceed their actual chances of victory. This may sound elementary, and many players may think they are following this principle, but few actually do.” Take out the word “horse” and insert the word “stock” and you’ve captured the essence of the problem. 

Our natural tendency is to buy what is doing well and to sell what is doing poorly. But as Crist emphasizes, it doesn’t really matter how fast the horse will run, it matters how fast the horse will run relative to the odds on the tote board. Great investors separate the fundamentals from the expectations, and average investors don’t. Most of us are average investors.   

My advice, then, is to try to be very explicit about segregating the fundamentals and the expectations. Sometimes high expectations stocks are attractive because the company will do better still than what’s in the price. Great. That’s a buy. Sometimes there are stocks with low expectations that are dear because the company can’t even meet those beat down results. That’s called a value trap. So, constantly and diligently ask and answer the question, “what’s priced in?” Doing so is very helpful.  

Buffett, Soros and Uncle Sam

 I recently came across an interesting piece comparing the returns of Warren Buffett and George Soros (h/t @ReformedBroker). The post immediately caught my attention, for both Buffett and Soros are two of my favorite minds in investing.  I am oversimplifying greatly, but from Buffett, I learned much about the importance of patience, quality and management integrity, while from Soros, I learned the importance of identifying self-fulfilling cycles and reflexive processes in financial markets. While some like to contrast these two gentlemen as taking opposing views to markets, I think their approaches are not mutually exclusive.  In fact, combining the lessons from these two gentlemen has been a potent force in crafting my own, unique approach to investing.

In the piece comparing the relative performance of Buffett and Soros, the author includes the following chart:

The author then asks, if “George's track record is better but Warren is richer. Why?” while offering the following answer:

The snowball of POSITIVE compounding for longer. Both were born in August 1930 and Warren ran his hedge fund from 1957 but George didn't set up his until 1969. Warren was lucky to be in Omaha while Dzjchdzhe Shorash was in Budapest, more affected by WW2. Also Warren got into currency trading and philanthropy later. George's outperformance is due to stronger international diversification and because reflexivity is ignored. Value investing is copied more than reflexivity investing. The boom bust of Eurozone sovereign credits and subprime CDOs are quintessential examples of reflexivity. Crises are PREDICTABLE. And profitable if you have expertise.

Sure some of these factors certainly played a role in Buffett’s wealth relative to Soros, though this is largely misleading and the most crucial point is ignored entirely. Simply put, these return figures are not presented on an apples to apples basis.  Buffett’s returns are presented using the growth in Berkshire Hathaway’s book value, while Soros’ returns are presented using his hedge funds’ returns.  In this comparison, the author is therefore comparing Buffett’s after-tax returns, with Soros’ pre-tax returns. (There is a second key point missed that many Buffett followers will pick up on: book value does not reflect the true realizable value of many Berkshire assets, and therefore, is understated relative to the intrinsic value of the company. While important, my intent here is to focus simply on the tax consequences so beyond this mention, I will skip digging into the consequences of this reality).

We can re-plot the relative returns of Soros and Buffett in order to more closely portray what the comparative returns would look like on an after-tax basis.  For the purposes of this comparison, I assumed that each year, 20% of Soros’ returns would be paid out in taxes.  This is obviously a simplification, and not intended to be historically accurate, as everyone has their own unique tax profile, and long and short-term trades have different consequences.  I am merely cherry-picking a number that if anything, is probably favorable to Soros in light of the following factors: 1) capital gains tax rates were higher than today’s 15% during much of the time period covered in this analysis; 2) we know that Soros profited in capital markets subject to hybrid tax rates between long and short-term capital gains (like commodity and foreign exchange markets); and, 3) from Soros’ own journal in Alchemy of Finance (which I strongly recommend reading), we know that he engaged in many short-term, speculative trades that would be subject to ordinary income tax rates.

There is a second simplification I’ve made for the purposes of this comparison in assuming that returns were earned on a straight-line basis, rather than calculating each individual’s returns per year, adjusting for taxes and plotting those out.  Again, the purpose here is to demonstrate the impact of taxes on returns, and not to be perfectly precise with who is better than whom.  

As we can see below, the end result looks quite different when compared on an after-tax basis:


Plotted this way, Buffett’s compounded annual growth rate (CAGR) remains 21.4%, while Soros’ is 21.0%.  Now some might argue that an investor in Berkshire would still have to pay taxes on his or her investment, and this is true, but the clear intent in the article cited was to compare the performance track-record of each investor as stated by the author, and as evidenced by the author’s focus on the CAGR of Berkshire’s book value, rather than the performance of the stock itself. 
One of the biggest problems with performance generally speaking is how reporting systemically does not take into account tax consequences, yet there can be huge differences between two strategies with identical “returns.”  In reality, it’s only after-tax returns that matter.  Buffett’s partner, Charlie Munger offered the following important point on targeting after-tax, rather than pre-tax returns (from Munger's "On the Art of Stock Picking"):
Another very simple effect I very seldom see discussed either by investment managers or anybody else is the effect of taxes. If you're going to buy something which compounds for 30 years at 15% per annum and you pay one 35% tax at the very end, the way that works out is that after taxes, you keep 13.3% per annum. In contrast, if you bought the same investment, but had to pay taxes every year of 35% out of the 15% that you earned, then your return would be 15% minus 35% of 15% or only 9.75% per year compounded. So the difference there is over 3.5%.And what 3.5% does to the numbers over long holding periods like 30 years is truly eye-opening. If you sit back for long, long stretches in great companies, you can get a huge edge from nothing but the way that income taxes work.

I am a fan and student of Mr. Buffett and Mr. Soros and have no bone to pick in this race, though it should be clear to all that both men’s returns are about as good as they get over such a long time-frame.  To summarize, there are two key points here that I want to emphasize.  For individual investors, it’s extremely important to plan your investments in such a way as to maximize after-tax, not pre-tax returns.  Don’t be fooled simply by the appreciation in your portfolio.  Think about what portion of your gains you are paying to Uncle Sam (taxes) come April 15th each year.  For those who work with investment managers or invest via funds, when looking at performance reports, it’s extremely important to think about what the after-tax returns of a strategy look like.


Disclosure: Long shares of BRK.B in my own and client accounts.


My Investment Checklist

Many great practitioners across a number of disciplines have professed admiration for a thorough checklist. Some notable investors who are in this camp include Warren Buffett, Charlie Munger, Michael Mauboussin and Mohnish Pabrai. There are many reasons to like a good checklist, for it's a great means through which to impose self-discipline and to leave no rock unturned in your analysis. Humans are constantly exposed to the perils of behavioral biases and checklists are the best method I have encountered to help combat human misjudgment (see some of my lessons learned from the Santa Fe Institute on Risk: the Human Factor).

Some people use checklists with binary (yes/no) questions, while others look for more thought-out analysis for each element. I have combined a little bit of both, with the aim of constructing a coherent and thorough basis for each investment I undertake. One of my goals in posting this checklist here is to elicit feedback from some of you readers out there on other elements that may be helpful, particularly in the qualitative areas. 

The Company:
1. Can I say what the company does in 1 sentence? 
2. Do I understand the product and the target market?
Valuation:
1. What is the stock price today implying about future expectations? WACC? Growth? 
2. What is the preferred method for valuation (or combo of methods)? Earnings power value? DCF? SOTP? Franchise value? 
3. What is a reasonably conservative Earnings Power Value? With Growth?
4. How do the company’s ratios compare to their competitors? Market on the whole?
5. Is there a readily identifiable reason for why the stock is cheap?
6. What are the company’s ROE/ROIC like? What are the trends over time? 
7. Does the company have operating leverage to grow earnings quicker than revenues?
8. Has intrinsic value been increasing regardless of the direction of the stock’s price?
9. Is the company’s ROIC greater than its WACC? 1 yr, 3 yr?
10. What does the MICAP say about the duration of expectations?
11. Is the company’s capital investment increasing or decreasing? What is the trend in returns on invested capital?
Balance sheet:
1. Is the company well capitalized?
2. How is its debt-to-equity compared to industry norms?
3. Is debt less than stockholder equity?
4. Is long-term debt less than 2x working capital?
5. Are there any hidden assets I should take note of? How can these assets be valued? What are they worth? 
Management:
1. How is managements track record with capital allocation?
2. What is management’s track record with options?
3. Is the incentive structure of management aligned with shareholders? Is management “overpaid”?
4. Does management manage for quarterly earnings, or are they long-term oriented?
5. How does the company use its excess earnings? Dividend? Buybacks? Invest in growth? Build cash balance?
6. How did present management come to lead the company?
7. Does the CEO have a passion for the business? Or the money?
Competitive Dynamics/Qualitative Factors:
1. Does the company have a moat? Is the moat growing or shrinking?
2. Does the company have a sustainable competitive advantage? If so, what is its source? Is there a structural/cost advantage?  Switching cost?  Brand loyalty?
3. Does the business have pricing power? i.e. can they raise prices without losing customers?
4. Is the business cyclical? If so, where in the cycle are we?
5. What is the company’s sector like? Is there any chance the core business is a bubble? Has regulation or subsidies contributed to sector strength? 
6. Is this a capital-intensive business?  What are the capital turns like?
7. What type of relationship does the company have with its suppliers?
8. Does the business generate recurring revenues? Or is it one-off transactions?
9. Is there a readily identifiable mental model that comes to mind with the company?
10. Does the company have a strong brand? Do customers have an emotional connection to the brand?  Does the brand imply a social status?
11. Does the brand increase willingness to pay? 
12. Do customers trust the product because of the name?
13. What’s the likelihood of a disruptive innovation in the core market? Where would it come from? Who would make it? Are any currently being funded?
14. What share of the industry’s revenues does the company earn? What share of the industry’s profitability does the company make?  How has the distribution of economic profit changed over time in the industry?
15. Is capacity in the industry increasing or decreasing?
16. Is there a high degree of differentiation in products between competitors? 
Growth:
1. What are the future growth prospects like for the business?
2. Are secular forces a tailwind to the company’s growth? If so, what are the driving secular forces?
3. Does the business grow organically? Through competition? Or Both?
4. Has historical growth been profitable?
5. Does management have a patient or rushed plan to pursue growth?
Ownership:
1. Are there any large institutional holders? If so, are they “likeminded” to our strategy?
2. Are large holders buying or selling?
Catalysts:
1. Are there any readily identifiable catalysts for the company?
2. What is the expected duration for our holding period?
3. Is the 3-5 year outlook better than the 6 months-1 year outlook? 
Risks:
1. What are the primary risks to the business’ profitability?
2. What are the risks to our thesis on the business?
3. What’s a low-end valuation assuming everything goes wrong?
4. How does the macro environment influence the company’s fundamentals?
 
Technicals:
1. Is the stock in an uptrend? Downtrend or sideways? How long has the prevailing trend lasted for?
2. How has the stock performed relative to the market over the past 6 months, 1 year, 3 years and 5 years?
3. How has the stock performed relative to its peers?
4. Is the stock “in the gutter” and if so, for how long?  
5. Has the stock recently violated a trough in “the gutter”?
Behavioral:
1. Can I afford to wait?
2. Are there identifiable sellers for uneconomic reasons? i.e. forced selling

Investment Checklist

How did Ed Thorp Win in Blackjack and the Stock Market?

My earlier post laid out some important lessons on behavioral economics learned from Santa Fe Institute’s conference on Risk: the Human Factor.  The specific lecture that first caught my eye when I saw the roster was Edward Thorp’s discussion on the Kelly Capital Growth Criterion for Risk Control.  I had read the book Fortune’s Formula and was fascinated by one of the core concepts of the book: the Kelly Criterion for capital appreciation. Over time, I have incorporated Kelly into my position-sizing criteria, and was deeply interested in learning from the first man who deployed Kelly in investing.  It's been mentioned that both Warren Buffett and Charlie Munger discussed Kelly with Thorp and used it in their own investment process.  Thus, I felt it necessary to give this particular lecture more attention.

In its simplest form, the Kelly Criterion is stated as follows:

The optimal Kelly wager = (p*(b+1)—1) / b where p is the probability (% chance of an event happening) and b is the odds received upon winning ($b per every $1 wagered).

It was Ed Thorp who first applied the Kelly Criterion in blackjack and then in the stock market.  The following is what I learned from his presentation at SFI. 

Thorp had figured out a strategy for counting cards, but was left wondering how to optimally manage his wager (in investing parlance, we’d call this position sizing).  The goal was a betting approach which would allow for the strategy to be deployed over a long period of time, for a maximized payout.  With the card counting strategy, Thorp in essence was creating a biased coin (a coin toss is your prototypical 50/50 wager, however in a biased coin, the odds are skewed to one side).  This question was approached from a position of how does one deal with risk, rationally?  Finding such a rational risk management strategy was very important, because even with a great strategy in the casino, it was all too easy to go broke before ever attaining successful results.  In other words, if the bets were too big, you would go broke fast, and if the bets were too small you simply would not optimize the payout.

Thorp was introduced to the Kelly formula by his colleague Claude Shannon at MIT.  Shannon was one of the sharpest minds at Bell Labs prior to his stint at MIT and is perhaps best known for his role in discovering/creating/inventing information theory.  While Shannon was at Bell Labs, he worked with a man named John Kelly who wrote a paper called “New Interpretation of Information Rate.”  This paper sought a solution to the problem of a horse racing gambler who receives tips over a noisy phone line.  The gambler can’t quite figure out with complete precision what is said over the fuzzy line; however, he knows enough to make an informed guess, thus imperfectly rigging the odds in his favor. 

What John Kelly did was figure out a way that such a gambler could bet to maximize the exponential rate of the growth of capital.  Kelly observed that in a coin toss, the bet should be equal to one’s edge, and further, as you increase your amount of capital, the rate of growth inevitably declines.

Shannon showed this paper to Thorp presented with a similar problem in blackjack, and Thorp then identified several key features of Kelly (g=growth below):

  1. If G>0 then the fortune tends towards infinity.
  2. If G<0 then the fortune tends towards 0.
  3. If g=0 then Xn oscillates wildly.
  4. If another strategy is “essentially different’ then the ratio of Kelly to the different strategy tends towards infinity.
  5. Kelly is the single quickest path to an aggregate goal.

This chart illustrates the points:


The peak in the middle is the Kelly point, where the optimized wager is situated.  The area to the right of the peak, where the tail heads straight down is in the zone of over-betting, and interestingly, the area to the left of the Kelly peak corresponds directly to the efficient frontier. 

Betting at the Kelly peak yields substantial drawdowns and wild upswings, and as a result is quite volatile on its path to capital appreciation.  Therefore, in essence, the efficient frontier is a path towards making Kelly wagers, while trading some portion of return for lower variance.  As Thorp observed, if you cut your Kelly wager in half, then you can get 3/4s the growth with far less volatility. 

Thorp told the tale of his early endeavors in casinos, and how the casinos scoffed at the notion that he could beat them.  One of the most interesting parts to me was how he felt emotionally despite having confidence in his mathematical edge. Specifically, Thorp felt that the impact of losses placed a heavy psychological burden on his morale, while gains did not have an equal and opposite boost to his psyche.  Further, he said that he found himself stashing some chips in his pocket so as to avoid letting the casino see them (despite the casino having an idea of how many he had outstanding) and possibly as a way to prevent over-betting.  This is somewhat irrational behavior amidst the quest for rational risk management

As the book Bringing Down the House and the movie 21 memorialized, we all know how well Kelly worked in the gambling context.  But how about when it comes to investing?  In 1974, Thorp started a hedge fund called Princeton/Newport Partners, and deployed the Kelly Criterion on a series of non-correlated wagers. To do this, he used warrants and derivatives in situations where they had deviated from the underlying security’s value.  Each wager was an independent wager, and all other exposures, like betas, currencies and interest rates were hedged to market neutrality. 

Princeton/Newport earned 15.8% annualized over its lifetime, with a 4.3% standard deviation, while the market earned 10.1% annualized with a 17.3% standard deviation (both numbers adjusted for dividends).  The returns were great on an absolute basis, but phenomenal on a risk-adjusted basis.  Over its 230 months of operation, money was made in 227 months, and lost in only 3.  All along, one of Thorp’s primary concerns had been what would happen to performance in an extreme event, yet in the 1987 Crash performance continued apace. 

Thorp spent a little bit of time talking about the team from Long Term Capital Management and described their strategy as the anti-Kelly.  The problem with LTCM, per Thorp, was that the LTCM crew “thought Kelly made no sense.”  The LTCM strategy was based on mean reversion, not capital growth, and most importantly, while Kelly was able to generate returns using no leverage, LTCM was “levering up substantially in order to pick up nickels in front of a bulldozer.”

Towards the end of his talk, Thorp told the story of a young Duke student who read his book called Beat the Dealer, about how to deploy Kelly and make money in the casino.  This young Duke student then ventured out to Las Vegas and made a substantial amount of money.  He then read Thorp’s book Beat the Market and went to UC-Irvine, where he used the Kelly formula in convertible debt to again make good money. Ultimately this young built the world’s largest bond fund—Pacific Investment Management Company (PIMCO).  This man was none other than Bill Gross and Thorp drew the important connection between Gross’ risk management as a money manager and his days in the casino.

During the Q&A, Bill Miller, of Legg Mason fame, asked Thorp an interesting two part question: is it more difficult to get an edge in today’s market? And Did LTCM not know tail risk and/or realize the correlations of their bets?  Thorp said that today the market is no more or less difficult than in year’s past.  As for LTCM, Thorp argued that their largest mistake was in failing to recognize that history was not a good boundary (plus the history LTCM looked at was only post-Depression, not age-old) and that without leverage, LTCM did not have a real edge. This is key—LTCM was merely a strategy to deploy leverage, not one to get an edge in the market.

I had the opportunity to ask Thorp a question and I wanted to focus on the emotional element he referenced from the casino days.  My question was:  upon recognizing the force of emotion upon himself, how did he manage to overcome his human emotional impediments and place complete conviction in his formula and strategy?  His answer was a direct reference to Daniel Kahneman’s Thinking, Fast and Slow, whereby he used his system 2, the slow thinking system, in order to force himself to follow the rules outlined by his formulas and process.  Emotion was a human reaction, but there was no room to afford it the opportunity to hinder the powerful force that is mathematics.

The Essential Mental Model for Understanding Innovation

The other day I came across this excellent video interview on the Harvard Business Review blog with Clayton Christensen discussing “disruptive innovation.”  As some of you may know, Christensen wrote The Innovator’s Dilemma.  This is one of the most important investment books for everyone to read.  It is essential for understanding the paradigm of innovation and disruption in business.  If there’s ANY tech CEO (or even non-tech CEO) who has not read this book I would have to seriously question their judgment as an executive.  This book is that important.  

Charlie Munger has told us investors that we need to have “mental models” upon which to build our world view and investment strategy (brief aside: there’s a really cool site called Think Mental Models which honors this investment credo.  I fully subscribe to this belief and as this blog develops, will look to share the models that are core to my investment philosophy).  The Innovator’s Dilemma, along with Porter’s Five Forces, create the lens through which to understanding the competitive landscape of any business, whether new or old.  Although the Innovator’s Dilemma tends to appear more relevant to the technology sector, as that is the home domain for the most high profile innovation in our economy, it is equally relevant to all industrial and service businesses alike.


The Dilemma

The crux of the dilemma is that there are outstanding businesses, highly attuned to their customers’ desires, outstanding at driving their product’s evolution forward, and supremely efficient at operating their businesses profitably, which ultimately succumb to failure.  Christensen labeled this a “dilemma” because these dominant market leaders fail precisely because of their managerial strengths.  This is so, because the smaller, innovative upstart competitors are willing to accept lower margins and lower product quality initially in order to break into niche segments beneath that of the dominant leader within the marketplace.  


By operating in this way, the young upstart is able to profitably grow a business while refining and developing the product until it eventually is a cheaper, better and eventually a replacement for what the dominant market leader has to offer.  Meanwhile, the market leader, in an effort to protect their market position and profit margins, and to cater to the needs of their largest customers, never enters into the new level to their core market because they refuse to take part in driving prices, margins and profits lower in the short-run.  Christensen narrates this phenomenon and develops the theory primarily through an analysis of the disk drive market, where these innovations tend to transpire at a far quicker pace than other arenas.  


Mark Suster, a “2x entrepreneur turned venture capitalist” wrote several outstanding posts on the Innovator’s Dilemma and how it not only impacts, but is a core element of his own personal investment strategy.  I highly recommend reading both The Amazing Power of Deflationary Economics for Startups and Understanding how the Innovator’s Dilemma Affects You. One point that I would add to Suster’s analysis is while the new firm accepts lower margins, they do so for particular products, not on a firm-wide scale.  These disruptive technologies are able to sell each unit of their product for a lower margin; however, their technology affords them the advantage to spread the fixed cost element in a much more beneficial way such that the firm-wide margins are far greater than the incumbent technology.  Typically the firm-wide advantage comes via the capacity to support enormous scale on a smaller operating structure.  This is particularly true in the Internet age.  And in this fact lies the ability to compete on price on a per unit basis.

Steve Blank is a pioneer in entrepreneurial theory, professor at Stanford and author of Four Steps to the Epiphany.  His impact is visible throughout the many innovative powerhouses born in Stanford.  He wrote an excellent post that relates the Innovator’s Dilemma to how large enterprises can cope and prosper in such an environment called The Search for the Fountain of Youth: Innovation and Entrepreneurship in the Enterprise.  This too is a must read.  

Investment Implications and the Mental Model 

Because these issues are so fundamentally important to companies both new and old, the connection to any investment strategy is important.  The s-curve model is the visual translation of the impact of the Dilemma.  (H/T to Your Brand is Showing for the graph)


As it pertains to market disruption, we look at the S-curve of the current technology relative to that of the emerging technology.  With every market leading technology, the product initially started off on a relatively slow growth trajectory.  Once it achieved a critical mass of adoption, the growth takes a parabolic trajectory; however, after adoption is ubiquitous, the growth plateaus.  Meanwhile, the young, emerging technology starts on a path beneath the current technology and crosses above the current in terms of both growth and efficiency (not necessarily quality just yet) at some point on its own parabolic phase of growth.  


These points are crucial for every investor, whether one focuses on growth or value.  For growth, the importance is obvious (invest in companies on the parabolic part of their growth trajectory), yet for value it's less so.  Understanding the Innovator's Dilemma is instrumental in determining whether some companies with solid track-records are experiencing a temporary blip, thus creating the value opportunity, or whether they are in fact being disrupted from beneath.  I look forward to sharing some anecdotal examples over time.